

Here's the real question bouncing around your head: Is this just normal wear, or am I already behind on making a move?
The tricky part isn't figuring out if your system is degrading-it obviously is. The tricky part is knowing when degradation crosses into "act now" territory versus "keep monitoring" territory. And with battery technology costs dropping faster than your system's capacity, timing this decision wrong in either direction costs you.
We've pulled together what actually matters for this call-not theory, not projections dressed up as certainties, but the operational signals that separate systems worth augmenting from systems that need full replacement.
What's Really Happening Inside an Aging Battery System
Think of your battery system like a long-distance runner who's been competing for four years straight. They can still finish races, but their recovery time is longer, their peak speed has dropped, and they're burning more energy to maintain the same pace.
That 87% capacity reading? It's just the finish time. It doesn't tell you about the runner's knees, their lung capacity, or whether they'll make it through next season.
The numbers you're probably tracking:
State of health (capacity retention)
Maybe round-trip efficiency
Possibly some thermal data
The numbers that actually predict when to upgrade:
How fast degradation is accelerating (not just where it is)
Auxiliary power consumption trends
Unplanned shutdowns and thermal protection events
Whether your available capacity during peak hours matches your total capacity
That last one catches a lot of operators off guard. A system showing 85% total capacity that can only deliver 70% during the hours that matter most has a bigger problem than the headline number suggests.
Why the Old "80% Capacity = Replace" Rule Doesn't Work Anymore
For years, the industry treated 80% state-of-health as the magic retirement number. Below 80%, you replace. Above 80%, you monitor.
That rule came from an era of NMC (nickel-manganese-cobalt) chemistry dominance, where dropping below 80% often triggered accelerated degradation-the battery equivalent of a car engine that starts burning oil once it hits 150,000 miles.
Modern LFP (lithium iron phosphate) systems don't behave this way. Research from Sandia National Laboratories demonstrates that commercial LFP cells maintain linear capacity fade even after cycling below 80% SOH-no dramatic "knee point" collapse like NMC chemistry. Some test cells continued operating normally at 60-70% SOH with no increased thermal runaway risk.[1]
That's a game-changer for how we think about retirement thresholds.
But-and this is a big but-your contracts don't care about chemistry improvements.
If you're committed to delivering specific capacity for grid services, hitting 79% means you're in breach territory regardless of whether your batteries could technically keep running for another three years.
|
Situation |
Old Rule Said |
Reality Says |
|
LFP system at 78% with no capacity contracts |
Replace immediately |
Could operate safely for 2-3 more years |
|
Any chemistry at 84% with firm grid commitments |
Keep monitoring |
Start planning now-degradation accelerates between 85-80% |
|
System at 82% with increasing thermal events |
Monitor until 80% |
Those thermal events matter more than the capacity number |
How the 80% rule breaks down in different real-world scenarios
The Four Signals That Actually Predict Upgrade Timing
Forget single-metric thresholds. The operators who time upgrades well are watching four dimensions simultaneously-and paying attention to how they intersect.
Signal 1: Degradation Trajectory (Not Just Current Position)
A system at 88% capacity degrading at 1% per year is in a completely different situation than a system at 88% degrading at 3% per year.
The first system has roughly 8 years before hitting 80%. The second has maybe 2.5 years-and degradation often accelerates as systems age, meaning that 2.5 years might become 18 months.
Good news: real-world degradation rates have improved significantly. According to Geotab's 2024 Battery Degradation Report analyzing over 10,000 EVs and storage units, average annual degradation has dropped from 2.3% in 2019 to approximately 1.8% today. Top-performing systems now show less than 1.0% annual fade.[2]
But here's the catch: that spread matters enormously. Your system could be in the <1% camp or the 3%+ outlier territory. Industry averages are nearly useless for your specific decision-what matters is YOUR system's trajectory.
What to track: Monthly state-of-health measurements (quarterly isn't frequent enough to catch inflection points). Watch for any sudden shift in degradation rate-that's often the first sign of emerging problems.

Signal 2: Balance-of-System Health
Here's something that surprised us when we first dug into failure data: the majority of battery system failures trace back to balance-of-system components-thermal management, power conversion, controls-not the battery cells themselves.
EPRI's BESS Failure Incident Database confirms this pattern. Among failures with identifiable root causes, "System Integration & BOS" dominates-inverters, thermal management, and connection components. Pure cell manufacturing defects account for a remarkably small share.[3]
Your batteries might be aging gracefully while your cooling system is quietly working itself to death compensating for them.
The canary in the coal mine: Auxiliary power consumption. According to TWAICE's technical analysis, healthy BESS auxiliary loads typically run between 0.5% and 2.5% of rated power. When this creeps above 3-4%, it usually signals HVAC inefficiency or increased cell thermal stress forcing the cooling system to overwork.[4]
Think of it like a car with a solid engine but a failing transmission. The engine could run another 100,000 miles, but you're not going anywhere without that transmission.
|
BOS Health Indicator |
Healthy Range |
Warning Zone |
Action Zone |
|
Auxiliary power consumption |
0.5 - 2.5% of rated power |
2.5 - 4% |
> 4% |
|
Thermal protection events |
0-1 per quarter |
2-3 per quarter |
4+ per quarter |
|
Unplanned shutdowns |
0 per year |
1-2 per year |
3+ per year |
|
System availability |
> 98% |
95-98% |
< 95% |
Table: BOS health indicators based on TWAICE analytics benchmarks[4]

Signal 3: Technology Gap
Battery costs have collapsed. Not "declined gradually"-collapsed.
BloombergNEF's 2024/2025 Lithium-Ion Battery Price Survey shows stationary storage battery pack prices have dropped to around $70/kWh-nearly half the $139/kWh average from just 2023. Turnkey system costs in China are approaching $100/kWh, with global averages sitting around $170-200/kWh.[5]
To put that in perspective: if you installed a system in 2020 at $400/kWh, today's replacement costs roughly half what you originally paid. That's like discovering your car's replacement engine costs 50% less than when you bought the vehicle.
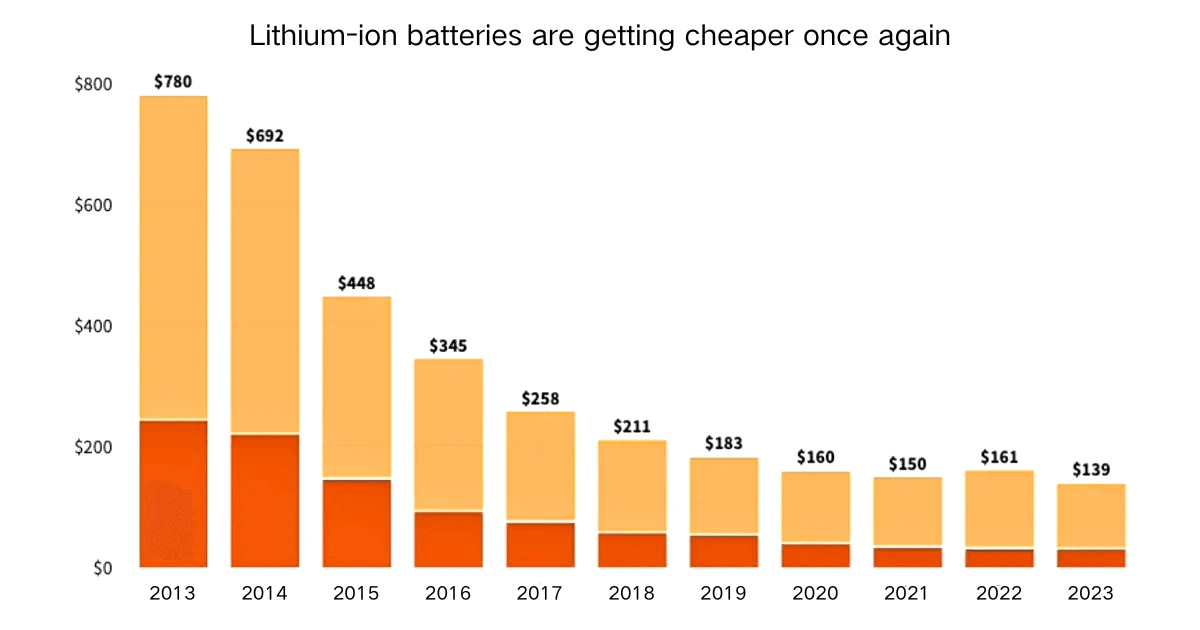
This creates a weird situation: the longer you wait, the cheaper replacement gets. But the longer you wait, the more operational capacity you're losing from your degraded system.
The break-even math depends on your specific situation, but there's a general principle worth understanding: the technology gap matters more when you're between 80-90% capacity than when you're below 75%.
Why? Because augmentation-adding new modules to your existing system-becomes viable when replacement technology has improved significantly AND your existing system still has enough life left to be worth building around. Below 75% capacity, you're typically better off with full replacement because you'd be replacing too much of the original system for augmentation economics to work.
Signal 4: Grid Needs vs. System Capabilities Mismatch
Your storage system was designed for how the grid worked when you installed it. The grid has moved on.
The shift is dramatic and documented. CAISO's 2024 Special Report on Battery Storage shows over 43% of battery capacity now primarily serves energy arbitrage, addressing 4+ hour evening net load peaks.[6] Systems designed for 2-hour peak shaving are increasingly mismatched with where the value lives.
Texas tells an even starker story. According to Modo Energy and EIA data, ERCOT battery revenue structure flipped almost overnight: in 2023, 85% of revenue came from ancillary services. By 2024, nearly 60% came from energy arbitrage.[7] Ancillary service markets saturated, forcing batteries to compete on duration they weren't designed for.
The question isn't just "can my system still do what it was designed for?" It's "is what my system was designed for still what the grid needs?"
If your original use case no longer matches where the operational opportunities are, you might need to upgrade even if your capacity looks fine-because you're systematically missing value that newer systems could capture.
How These Signals Combine: A Decision Framework That Actually Works
Single thresholds fail because they ignore interactions. A system at 88% capacity might be fine-or might need immediate attention-depending on what else is happening.
Instead of asking "what's my capacity?", ask "how many warning signals are active?"
Zero or one signal active → Monitor Zone Keep tracking monthly. Establish baselines. Nothing urgent, but don't get complacent.
Two signals active → Planning Zone Start engineering assessments. Get proposals from multiple vendors. Model both augmentation and replacement scenarios. This phase typically takes 4-6 months for commercial systems, 8-12 months for utility-scale.
This is where most operators make mistakes-they wait for everything to turn red simultaneously, which means they've already been losing value for months by the time they act.
Three or four signals active → Action Zone Execute within 3-6 months. Further waiting costs more than any savings from technology improvements.
Augmentation vs. Full Replacement: How to Know Which Path Fits
"Upgrade" doesn't automatically mean ripping everything out and starting fresh. Battery augmentation-adding new modules to your existing infrastructure-delivers compelling results when the conditions are right.
NREL's 2024 Annual Technology Baseline breaks down why: BOS components (inverters, grid connection infrastructure, thermal systems) represent roughly 30-40% of new-build costs. When you can reuse that infrastructure, augmentation CAPEX typically lands in the 40-50% range of full replacement cost-depending on remaining BOS lifespan.[8]
That's not a small savings. On a 20 MWh system where full replacement might run $3.4 million, augmentation could come in under $1.7 million if conditions align.
Augmentation works when:
Your existing LFP chemistry aligns with current LFP offerings (chemistry matching matters for integration). Your inverters and power conversion systems have headroom for additional capacity. Your balance-of-system infrastructure-racking, thermal management-can accommodate expansion without major modification. Your capacity sits in the 75-85% range, giving you enough existing foundation to build on.
Full replacement makes more sense when:
Capacity has dropped below 70%. Your chemistry is fundamentally outdated (early NMC systems facing LFP-dominant markets). BOS components show recurring failures or significant aging. Your operational needs have shifted dramatically-say, from 2-hour to 6-hour duration requirements. Physical constraints prevent expansion.
Timing matters here too. The sweet spot for augmentation analysis is when capacity hits 80-85%-early enough that your existing system provides meaningful value to build around, late enough that you have clear data on how it's aging.
What's Actually Available Now vs. What's Still Hype
One reason operators hesitate on upgrade decisions: fear of better technology showing up next year. Let's separate what you can actually deploy today from what's still in development.
Deployable Now (2024-2025)
LFP (Lithium Iron Phosphate): The default choice for most stationary storage projects. Well-understood degradation characteristics (remember that linear fade below 80%[1]), strong safety profile, and with pack prices around $70/kWh[5], extremely competitive.
Sodium-ion: No longer experimental. CATL, BYD, and others have shipped commercial installations. Cost advantages over lithium-ion, comparable cycle life. Tradeoff: roughly 30% lower energy density, meaning more physical space required. For applications where land isn't constrained, increasingly attractive.
Coming in 2-4 Years
Solid-state batteries: Real pilot production lines exist. Limited commercial availability likely by 2027. But-initial products will carry premium pricing, and stationary storage doesn't desperately need solid-state's main advantages (higher density, lighter weight) the way EVs do.
Flow batteries: Already utility-scale viable for specific applications. Iron flow batteries entering North American markets. Shine in very long-duration applications (6-10+ hours). Still less compelling than lithium for 2-4 hour needs.
Still Research-Phase
Lithium-metal, lithium-sulfur, zinc-air, organic flow. Laboratory promise, but commercial deployment remains 5+ years away. Don't factor these into upgrade decisions before 2030.
Bottom line: If you're upgrading in 2025-2027, your realistic choices are LFP, sodium-ion, or possibly iron flow for long-duration needs. The technology landscape is clearer than vendor marketing suggests.
Regional Differences That Shift Your Timeline
Grid structure, weather patterns, and regulatory frameworks create real variations in optimal upgrade timing-sometimes shifting decision points by 12-18 months.
California/CAISO: With 43% of battery capacity now serving 4+ hour arbitrage windows[6], degraded capacity has outsized impact. Systems here often justify earlier action-85-88% capacity rather than waiting for 80%.
Texas/ERCOT: The dramatic shift from ancillary services (85% of revenue in 2023) to arbitrage (60% in 2024)[7] means duration matters more than ever. A system that can't fully respond during a critical 4-6 hour peak period misses enormous value during limited hours per year. Optimize for guaranteed capacity during extreme conditions, not average performance.
Northeast (PJM/ISO-NE): Heavy emphasis on capacity commitments and ancillary services. Systems can often operate productively to 75% if they meet qualification thresholds-but complex performance requirements may trigger disqualification even at higher capacity levels.
UK Capacity Market: Here's where policy actually helps. The UK's 2024 Capacity Market Rules update formally established "Permitted Battery Augmentation" provisions-operators can now replace or add modules mid-contract to maintain capacity, validated through Extended Performance Testing (EPT) without triggering contract breach.[9] This makes augmentation strategies significantly more viable for UK operators.
Australia NEM: Market mechanisms favor longer-duration storage. Duration enhancement weighs heavier in upgrade decisions here. Moving from 2-hour to 4-hour capability delivers substantial value, potentially shifting upgrade timing earlier than pure degradation would indicate.
Building Your Monitoring Protocol
Most operators track capacity. Few track the broader data that actually enables good timing decisions.
Monthly (not quarterly):
State-of-health measurements
Auxiliary power consumption as percentage of rated power (remember: healthy is 0.5-2.5%, concerning is >3%[4])
Any thermal protection activations or unusual BMS alerts
Quarterly:
Available capacity specifically during peak demand periods (this often differs from total capacity)
Cycle depth distribution-are actual usage patterns matching design assumptions?
System availability metrics
Annually:
Full engineering assessment of BOS components
Comparison of current operational profile vs. grid value opportunities
Technology gap analysis-how much have replacement/augmentation options improved?
For multi-megawatt systems, third-party battery intelligence platforms (TWAICE, Accure, etc.) offer sophisticated analytics that can surface patterns you'd miss with basic monitoring.
[PLACEHOLDER: Monitoring dashboard mockup] Suggested: Visual representation of key metrics to track, as a sample dashboard layout with example data showing healthy vs. concerning trends.
Putting It Together: A Real Scenario
A 5 MW / 20 MWh LFP system in Texas, commissioned in 2020:
Current status:
83% state-of-health after 4.5 years
Degradation accelerating from 1.5% to 2.3% annually
Auxiliary power consumption up from 2.1% to 3.4% (crossing into warning territory[4])
Two unplanned thermal shutdowns in the past six months
Available capacity during summer peaks: ~70% of rated
Signal check:
Signal 1 (Degradation): 83% isn't critical alone, but accelerating rate (2.3% → roughly 78% in two years) plus the trend direction puts this in warning territory. Note this system is degrading faster than the current 1.8% industry average.[2]
Signal 2 (BOS Health): Auxiliary consumption at 3.4% plus thermal shutdowns = clear warning. This isn't just capacity fade-the supporting systems are stressed.
Signal 3 (Technology Gap): 2020 installation likely cost $350-400/kWh. Current turnkey systems at $170-200/kWh[5] represent massive improvement. Strong case for action.
Signal 4 (Grid Match): Texas + limited peak availability + the 2024 shift to 60% arbitrage revenue[7] = this 2-hour-optimized system is increasingly mismatched with market needs.
Assessment: Three signals clearly active, fourth (grid match) also problematic. This is Action Zone territory.
Recommendation: Given BOS stress indicators, augmentation carries meaningful risk-you'd be adding new batteries to a system with aging thermal management. Full replacement makes more sense here. Target completion before summer 2026 to capture peak season at full capability rather than degraded performance.
Key Takeaways
The 80% capacity rule is outdated, but not useless. Modern LFP systems can technically operate below 80% without knee-point collapse[1]-but your contracts, grid requirements, and BOS health often force action earlier.
Balance-of-system health matters as much as battery degradation. Those thermal events, those auxiliary power creeps above 3%[4], those unplanned shutdowns-they're telling you something capacity numbers miss.
Four signals beat single thresholds. Watch degradation trajectory, BOS health, technology gap, and grid-needs match simultaneously. When three or more turn concerning, it's time to act.
Augmentation can cut costs to 40-50% of full replacement[8]-but only when conditions align. Failing BOS, chemistry mismatch, or sub-75% capacity pushes toward full replacement.
The technology landscape for 2025-2027 upgrades is actually pretty clear. With pack prices at $70/kWh[5], you're choosing between LFP, sodium-ion, or flow batteries for long-duration. Revolutionary breakthroughs aren't arriving in time to justify waiting.
Regional grid dynamics shift your timeline significantly. California's 4+ hour arbitrage focus[6] and Texas's revenue structure flip[7] both favor earlier action for duration-limited systems.
Need help assessing where your specific system sits in this framework? contact us!
[1]: Sandia National Laboratories, "Degradation of Commercial Li-ion Cells Beyond 80% Capacity"; Journal of Power Sources (2023/2024). Research demonstrates LFP cells maintain linear capacity fade below 80% SOH without NMC-style knee point degradation, with some cells operating normally at 60-70% SOH.
[2]: Geotab, "2024 Battery Degradation Report." Analysis of 10,000+ EVs and storage units showing average annual degradation improved from 2.3% (2019) to 1.8% (2024), with best performers below 1.0%.
[3]: EPRI, "BESS Failure Incident Database Report (2024)." Root cause analysis showing system integration and BOS components as primary failure drivers, with pure cell manufacturing defects representing minimal share.
[4]: TWAICE, "Battery Analytics Whitepaper: Auxiliary Load & Efficiency." Benchmarks healthy auxiliary load at 0.5-2.5% of rated power; loads exceeding 3-4% indicate HVAC inefficiency or thermal stress.
[5]: BloombergNEF, "2024/2025 Lithium-Ion Battery Price Survey." Stationary storage pack prices at ~$70/kWh (down from $139/kWh in 2023); turnkey systems ~$100/kWh (China) to $170-200/kWh (global average).
[6]: CAISO, "2024 Special Report on Battery Storage." Over 43% of battery capacity now primarily serves energy arbitrage for 4+ hour evening net load peaks.
[7]: Modo Energy / EIA, "2024 US Battery Storage Market Update." ERCOT battery revenue shifted from 85% ancillary services (2023) to nearly 60% energy arbitrage (2024).
[8]: NREL, "2024 Annual Technology Baseline (ATB) - Utility-Scale Battery Storage." BOS represents ~30-40% of new-build costs; augmentation CAPEX typically 40-50% of full replacement when reusing existing infrastructure.
[9]: UK Department for Energy Security and Net Zero (DESNZ), "Capacity Market Rules 2024 Update." Establishes "Permitted Battery Augmentation" provisions allowing mid-contract module replacement/addition validated through Extended Performance Testing.